Introduction
In the ever-evolving world of cryptocurrency, the analysis of Bitcoin’s price movements is crucial for traders and investors. With the Bitcoin market experiencing fluctuations that can lead to significant gains or losses, many are turning to technical analysis tools. One such popular tool is the Fibonacci retracement, which helps to identify potential reversal levels in the market. According to recent studies, the Bitcoin market has seen a 150% increase in trading volume year-over-year, indicating a growing interest among both novice and experienced traders.
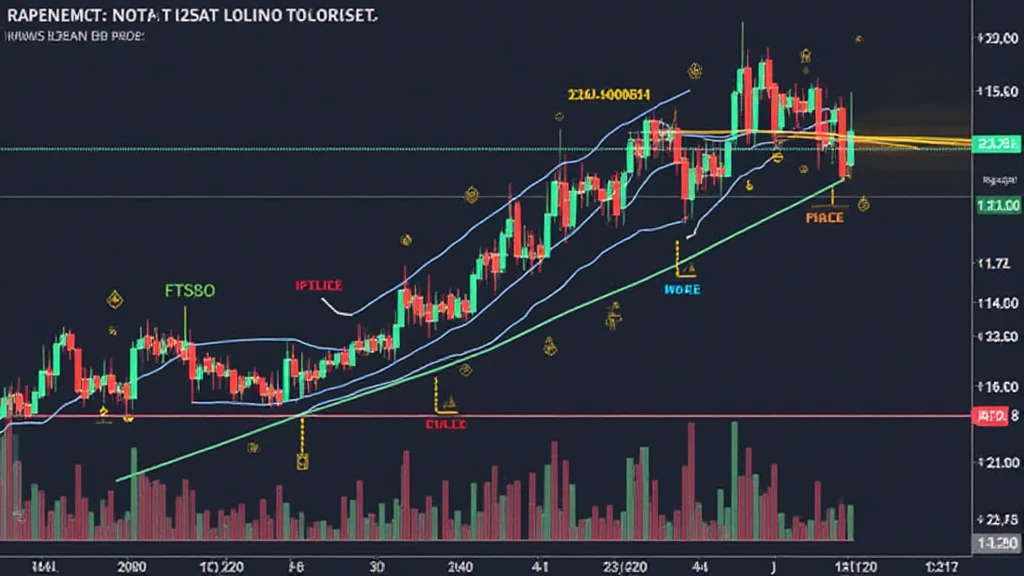
This article will delve into Bitcoin price analysis using Fibonacci retracement techniques, discussing their significance, application, and benefits for predicting price movements. Whether you’re aiming to enter the market or want to refine your trading strategies, understanding these tools will provide you with valuable insights.
The Basics of Fibonacci Retracement
Fibonacci retracement is a technical analysis tool based on the Fibonacci sequence, a series of numbers where each one is the sum of the two preceding ones. This series is not just a number game; it reflects a natural phenomenon seen throughout various segments of the universe, including financial markets.

- Fibonacci Levels: The key Fibonacci retracement levels are 23.6%, 38.2%, 50%, 61.8%, and 100%. These percentages represent potential reversal levels.
- Application: Traders typically draw these levels on a price chart after a significant price move, which helps in identifying potential support and resistance zones.
- Market Psychology: The effectiveness of Fibonacci retracement levels often stems from collective market psychology; many traders use these levels, leading to self-fulfilling prophecies.
How to Apply Fibonacci Retracement to Bitcoin Price Analysis
Applying Fibonacci retracement in Bitcoin price analysis can be boiled down to a few simple steps. Here’s how to get started:
- Identify the Trend: First, determine the current trend of Bitcoin—whether it’s an uptrend or downtrend.
- Select the High and Low: For an uptrend, select the significant swing low and swing high; for a downtrend, do the opposite.
- Draw the Retracement Levels: Using a charting platform, draw horizontal lines at the selected Fibonacci levels between the identified high and low points.
- Analyze Price Action: Observe how the price interacts with these levels to anticipate potential reversals or continuation of the trend.
Let’s break it down with an actual example. If Bitcoin surged from $40,000 (swing low) to $60,000 (swing high), the Fibonacci levels are drawn between these two points. For instance, a correction to $53,000 (61.8% retracement level) may indicate a good buying opportunity.
Real-World Applications in the Vietnamese Market
In Vietnam, the cryptocurrency landscape is rapidly changing. Recent statistics show that the number of active crypto users in Vietnam has increased by 250% in 2023 alone, a testament to the growing interest in digital assets. As local traders begin utilizing tools like Fibonacci retracement, it is crucial to understand how these techniques apply to the local trading environment.
Market Sentiment: Vietnamese traders often react to global news impacting Bitcoin, making Fibonacci retracement levels especially relevant during these times of heightened volatility.
Common Mistakes and How to Avoid Them
Even with the power of Fibonacci retracement, traders can often miss opportunities or misinterpret signals. Here are common pitfalls and tips to avoid them:
- Ignoring Other Indicators: Relying solely on Fibonacci levels without corroborating data from other technical indicators can lead to misguided decisions. Always complement your analysis with additional tools like RSI or MACD.
- Forgetting Market Fundamentals: Technical analysis is powerful, yet it’s essential to stay updated with market news as fundamentals can greatly influence price action.
- Overtrading: Just because a Fibonacci level is showing a strong signal doesn’t mean you should make impulsive trades. Plan your entries and exits based on comprehensive analysis.
The Future of Bitcoin Price Analysis Using Fibonacci Retracement
As we look forward, the integration of advanced trading tools like Fibonacci retracement will only become more vital for traders. According to estimates, by 2025, cryptocurrency adoption in countries like Vietnam is projected to reach 20% of the population, emphasizing the necessity for effective technical analysis capabilities.
New traders will benefit from educational resources and tools tailored for the Vietnamese market, allowing for enhanced trading strategies that incorporate Fibonacci retracement efficiently.
Conclusion
In conclusion, analyzing Bitcoin’s price movements using Fibonacci retracement offers traders a robust framework to anticipate market behavior. As the Vietnamese market continues to grow, adopting these technical strategies will be essential for making informed trading decisions. Whether you are investing for the long term or looking to make short-term gains, leveraging Fibonacci levels can provide a clearer roadmap.
For more insights into cryptocurrency trading and to stay updated, make sure to check out bitcryptodeposit. Remember, investing in cryptocurrencies carries risks, and it’s always advisable to consult with local regulatory authorities before making any financial decisions.
Written by: Dr. John Milton, a recognized financial analyst with over 15 published papers in the field of cryptocurrency and blockchain technology. He has led numerous audits for fintech companies and remains at the forefront of industry insights.


