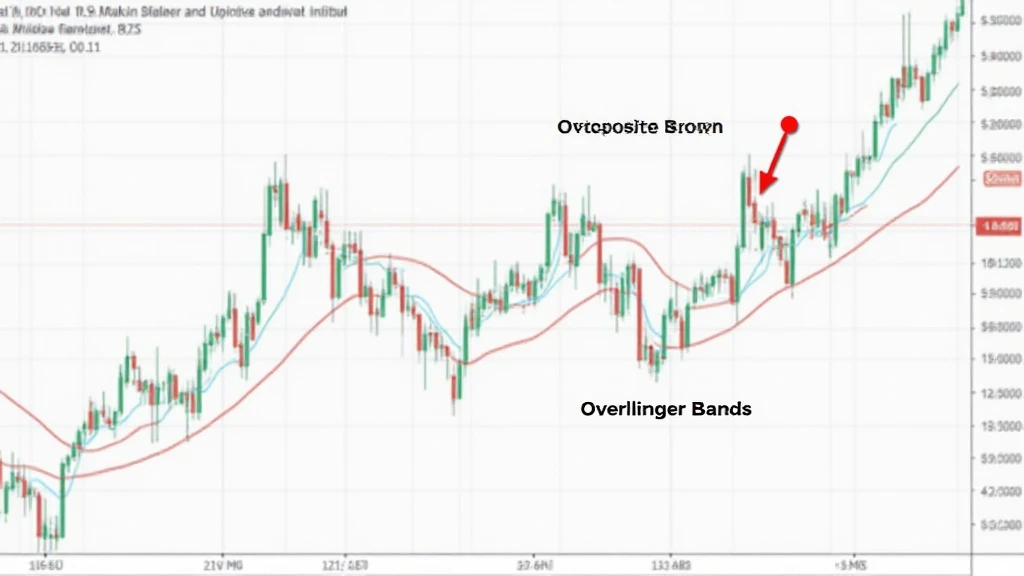
Mastering Bitcoin Price Technical Analysis Using Bollinger Bands
In the fast-paced world of cryptocurrency, understanding the Bitcoin price technical analysis using Bollinger Bands can make all the difference in trading decisions. Did you know that approximately $4.1 billion was lost to DeFi hacks in 2024? Protecting your investments is more critical than ever. By harnessing the power of Bollinger Bands, traders can gain crucial insights into market volatility and price action, enhancing their chances of making profitable trades.
This article promises to equip you with the knowledge and strategies necessary to effectively use Bollinger Bands in your technical analysis. We’ll cover everything from the basics to advanced applications, ensuring you’re well-prepared to navigate the cryptocurrency landscape.
Understanding Bollinger Bands
Bollinger Bands, developed by John Bollinger in the 1980s, are a type of statistical chart characterizing the prices and volatility over time of a financial instrument. They consist of three lines:

- Middle Band: This is a simple moving average (SMA) of the closing prices over a specified number of periods, typically 20.
- Upper Band: This is the middle band plus two standard deviations of the price, calculated to gauge market volatility.
- Lower Band: This is the middle band minus two standard deviations, providing a lower boundary to the price movement.
As price movements occur in an asset, Bollinger Bands expand or contract, indicating the current volatility of the asset. For traders in the Vietnamese market, understanding this indicator is vital due to the rapidly growing user base in the country, where cryptocurrency engagement has been increasing significantly.
How to Interpret Bollinger Bands in Bitcoin Trading
Let’s break it down. Interpreting Bollinger Bands involves recognizing key patterns based on price action:
- Price Touching the Upper Band: This often signals that the asset might be overbought, and a price retracement could follow.
- Price Touching the Lower Band: Conversely, this could indicate that the asset is oversold, which might lead to a price increase.
- Band Squeezes: When the bands come closer together, it indicates a period of low volatility and possibly a forthcoming price breakout.
Utilizing these signals can provide traders with a systematic approach to buying and selling Bitcoin. For example, when the price reaches the upper band, traders might consider selling their holdings, while reaching the lower band could prompt a buy signal.
Combining Bollinger Bands with Additional Indicators
While Bollinger Bands are powerful on their own, enhancing them with other indicators can improve the robustness of your analysis:
- Relative Strength Index (RSI): By measuring the speed and change of price movements, RSI can help confirm whether an asset is overbought or oversold.
- Moving Averages: Using short-term moving averages alongside Bollinger Bands helps identify trend directions and strengthen entry and exit signals.
Incorporating these tools into your strategy allows for a more comprehensive understanding of market dynamics, ultimately leading to better decision-making.
Real-life Examples and Case Studies
Now, let’s look at some real-world examples of Bitcoin price movements using Bollinger Bands:
Example 1: During the last market surge in early 2025, Bitcoin’s price frequently touched the upper band, indicating a potential overbought condition. Those who took profits during these touches often saw gains when the price corrected.
Example 2: In contrast, after experiencing substantial declines, Bitcoin’s price often rebounded after touching the lower band. Traders who bought during these instances frequently enjoyed substantial gains as prices recovered.
These examples highlight how crucial it is to track price movements in relation to Bollinger Bands and how applying technical analysis in real time can improve profitability.
Conclusion and Future Trends
As we look towards the future, it’s evident that understanding Bitcoin price technical analysis using Bollinger Bands can significantly enhance trading decisions. With the continued evolution of the cryptocurrency market, traders should remain adaptable and consistently apply these analytical techniques.
In summary, by mastering Bollinger Bands and integrating them with other technical indicators, traders can stay informed and strategically poised to capitalize on price movements. In a market characterized by rapid changes, such strategies are more essential than ever.
If you’re interested in further enhancing your trading abilities, consider exploring more resources on hibt.com. You can gain insights that could very well redefine your trading approach.
As a final note, always remember to consult local regulations as you navigate your cryptocurrency journey.
Author: Dr. An Nguyen, a prominent figure in the cryptocurrency research community, has published over 30 papers on blockchain technology and has led audits for several high-profile DeFi projects.


