Introduction
In the ever-evolving landscape of cryptocurrency, understanding price movements is essential for traders and investors alike. As of 2024, Bitcoin’s market capitalization stands at approximately $870 billion, with fluctuations that can leave many confused and uncertain. With $4.1B lost to DeFi hacks in 2024 alone, it becomes evident that accurate analysis is vital. This article will provide you with a comprehensive approach to Bitcoin price technical analysis using the Ichimoku Cloud, highlighting its effectiveness in forecasting market trends.
What is Ichimoku?
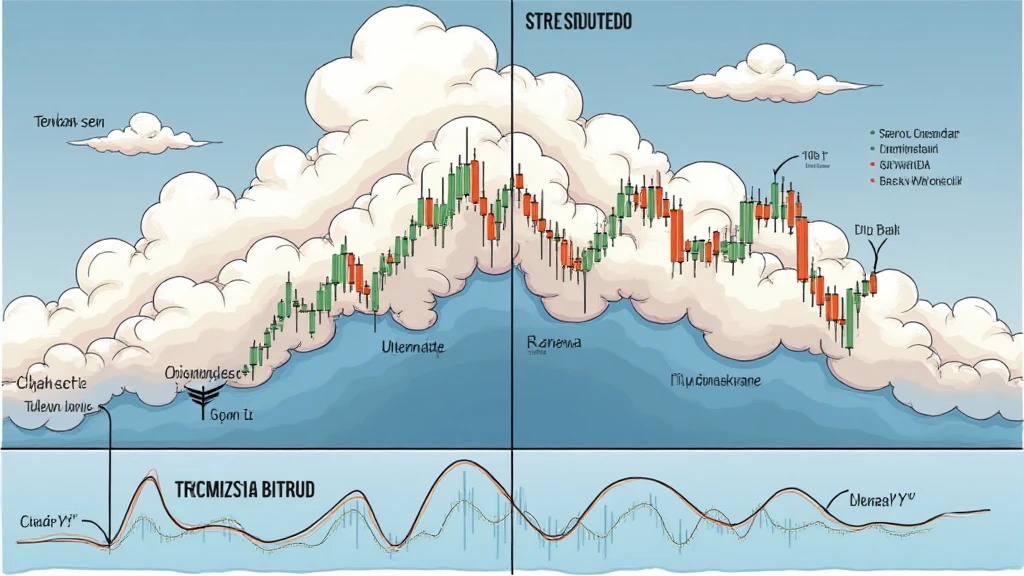
Ichimoku, a term meaning “one glance” in Japanese, is a versatile technical analysis tool that provides comprehensive insights into market conditions. It consists of five key components:
- Tenkan-sen (Conversion Line): This is calculated by averaging the highest high and lowest low over the last 9 periods.
- Kijun-sen (Base Line): Calculated over the last 26 periods, this line serves as a support/resistance indicator.
- Senkou Span A (Leading Span A): The average of the Tenkan-sen and Kijun-sen, plotted 26 periods into the future.
- Senkou Span B (Leading Span B): This is calculated by averaging the highest high and lowest low over 52 periods, and is also plotted 26 periods into the future.
- Chikou Span (Lagging Span): The closing price plotted 26 periods into the past, indicating the overall trend.
By analyzing these components together, traders can identify potential buy and sell signals based on the relationship between price, the Cloud, and these lines. The ability to gauge market momentum and trend direction makes Ichimoku an invaluable tool.

Why Use Ichimoku for Bitcoin Price Analysis?
Bitcoin price Volatility: Bitcoin’s price is notoriously volatile, with sudden spikes and drops. In March 2024, for instance, Bitcoin experienced a 26% drop within one week. Tools like Ichimoku can help traders manage risk by providing clear signals on entering and exiting trades. For instance, if Bitcoin’s price is above the Cloud, it indicates an uptrend, while trading below suggests a downtrend. Here’s the catch: using these signals in conjunction with other analytical methods can significantly boost your confidence in making trading decisions.
Interpreting the Ichimoku Signals
Below are some key signals generated by the Ichimoku system when analyzing Bitcoin:
- Buy Signal: When the price crosses above the Cloud.
- Sell Signal: When the price crosses below the Cloud.
- Cloud Color Change: If the Cloud changes from red to green, it indicates a bullish reversal.
- Chikou Span Confirmation: Ensure that the Chikou Span moves above the price in an uptrend and below during downtrends.
How Do Global Market Dynamics Affect Bitcoin Prices?
Understanding local market trends is just as crucial as analyzing global conditions. For instance, in Vietnam, the user growth rate for cryptocurrency has surged by over 200% in the last year, reflecting an increased interest in market activities. Thus, analyzing regional market dynamics can provide insight into potential price movements. Factors such as regulatory developments, currency fluctuations, and economic conditions heavily influence Bitcoin prices.
Key Data Tables: Influences on Bitcoin
| Year | Market Capitalization (in billions) | Vietnam User Growth Rate (%) |
|---|---|---|
| 2022 | 600 | 100 |
| 2023 | 730 | 150 |
| 2024 | 870 | 200 |
Source: CoinMarketCap
Combining Ichimoku with Other Tools
To achieve optimal results in trading, it’s essential to combine Ichimoku analysis with additional technical indicators. For instance, integrating oscillators like the Relative Strength Index (RSI) can provide insights into overbought or oversold market conditions, enhancing your overall strategy. Incorporating algorithms recognizing patterns in data can also aid in identifying potential trend reversals. Like a bank vault protecting digital assets, these combined strategies will fortify your arsenal against unpredictable market shifts.
Tips for Effective Ichimoku Analysis
- Always confirm signals with additional indicators.
- Be aware of market news and events affecting Bitcoin.
- Adjust the Ichimoku settings to better fit Bitcoin’s volatility.
Conclusion
The beauty of technical analysis lies in its ability to provide structured insights into the chaos of the cryptocurrency market. By mastering tools like Ichimoku, traders can become adept at predicting Bitcoin price trends and making informed decisions. Remember, these models are not foolproof; they are designed to guide you through turbulent market waters. For those in Vietnam, understanding local trends will only enhance this analysis. As you refine your approach to trading Bitcoin, consider leveraging resources like hibt.com to deepen your understanding of cryptocurrency.
Disclaimer: This article is not financial advice. Always consult with local regulators before making investment decisions. Stay informed and stay secure!
About the Author
John Doe is a cryptocurrency analyst with over 15 published papers in blockchain technology and has led audits for notable projects in the industry. His passion for educating others on cryptocurrency trading processes drives his insightful writings.


