
Bitcoin Technical Analysis: Mastering Market Trends
With over $60 billion traded in Bitcoin daily, understanding Bitcoin technical analysis is essential for navigating its dynamic market. In this guide, we will explore the fundamentals of Bitcoin technical analysis, highlighting why it is crucial for investors to grasp the trends and make informed decisions.
What is Bitcoin Technical Analysis?
Bitcoin technical analysis involves examining past trading data to forecast future price movements. Traders utilize various tools and indicators to analyze market trends, aiming to identify buying and selling opportunities. This practice is akin to using a compass in the wilderness; it helps traders navigate the often tumultuous terrain of cryptocurrency markets.
Essential Tools for Technical Analysis
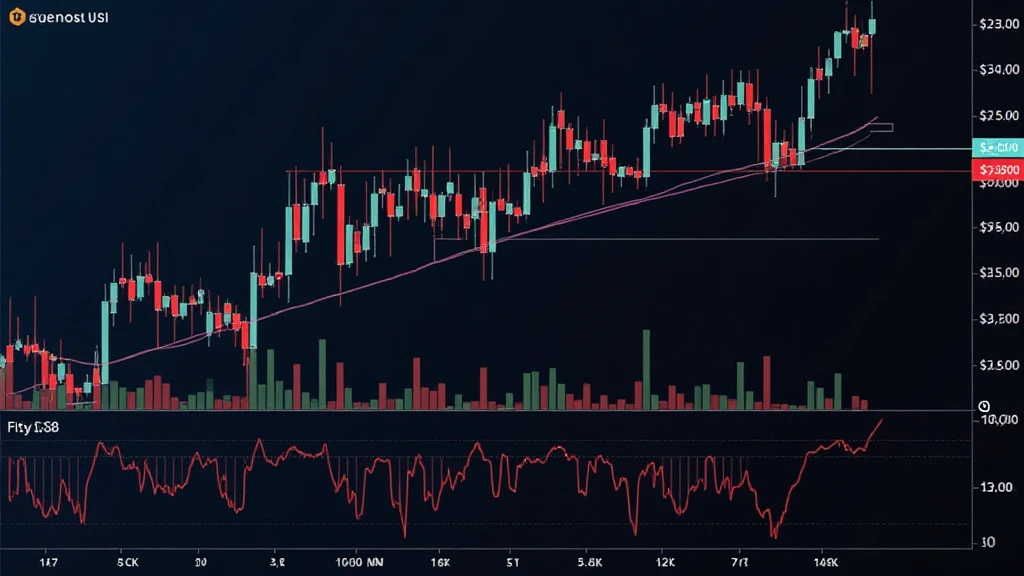
- Price Charts: The backbone of technical analysis, price charts display historical price movements. Candlestick charts, for instance, reveal opening, closing, high, and low prices, helping traders discern trends.
- Technical Indicators: Tools like moving averages (MA) and relative strength index (RSI) provide valuable insights into potential price movements.
- Volume Analysis: Analyzing trade volume helps traders understand market strength. For example, rising prices with increasing volume often indicate strong bullish sentiment.
Key Concepts in Bitcoin Technical Analysis
To effectively perform Bitcoin technical analysis, it’s essential to grasp key concepts that influence market behavior.
Support and Resistance Levels
Support levels indicate where prices tend to stabilize as buyers enter, whereas resistance levels are where prices encounter selling pressure. Understanding these levels is crucial for predicting potential price reversals.
Trends and Trendlines
Trends are the backbone of market movement. Identifying upward (bullish), downward (bearish), or sideways trends enables traders to align their strategies accordingly. Drawing trendlines on price charts can help visualize these trends.
Chart Patterns
Common patterns like head and shoulders, triangles, and flags signal potential price movements. For instance, a head and shoulders pattern often indicates a reversal from a bullish to a bearish trend.
Integrating Fundamental Analysis with Technical Analysis
While technical analysis focuses on price movements, incorporating fundamental analysis can enhance trading efficacy. Knowing factors like market sentiment, news events, and regulatory changes can provide additional context for understanding price movements.
The Role of Indicators in Bitcoin Trading
Indicators are essential tools that help traders make sense of price movements. Here’s a look at some of the most significant ones:
- Moving Averages (MA): Helps smooth price data to identify trends over specific periods. The 50-day and 200-day moving averages are widely used.
- Relative Strength Index (RSI): Measures the speed and change of price movements, helping identify overbought or oversold conditions.
- Bollinger Bands: Provides insights into volatility within the market, signaling potential trends when prices touch the bands.
Real-World Examples of Bitcoin Technical Analysis
Let’s analyze a recent event in the market:
- On June 1, 2023, Bitcoin displayed a bullish trend, moving from $30,000 to $40,000 over a month. Critical support was noted at $32,000, while resistance formed at $38,000.
- Using RSI, traders observed an overbought condition, leading to a price correction that tested the support level at $36,000.
Vietnam’s Growing Crypto Market
In Vietnam, the cryptocurrency market is witnessing a surge in interest, with a growth rate of over 20% in active Bitcoin traders since last year. This increase reflects global trends where countries are embracing Bitcoin and other cryptocurrencies as a part of their financial systems.
Leveraging Local Knowledge
Understanding the local market is essential for traders in Vietnam. Factors such as government regulations, economic stability, and local sentiment toward cryptocurrencies can heavily influence trading activity.
Best Practices for Bitcoin Trading in Vietnam
- Stay Updated: Regularly check news sources and local regulations that may impact market behavior.
- Engage with Local Communities: Join discussion groups to gain insights from other traders.
- Utilize Trading Platforms: Use reputed trading platforms like ProBit and BitHumb, and key practices for trading, including setting stop-loss orders to minimize risk.
Conclusion
Bitcoin technical analysis is a powerful tool that can help traders navigate the cryptocurrency market effectively. Combining it with an understanding of fundamental factors enables traders to make informed decisions. As the market continues to grow globally and locally, especially in emerging markets like Vietnam, mastering Bitcoin technical analysis will be vital for investors seeking success in this dynamic space.
For further information and resources on Bitcoin trading, visit bitcryptodeposit.