
Understanding Bitcoin Price Chart Patterns: A Comprehensive Guide
As the cryptocurrency market continues to grow, one question that often arises is: “What influences the Bitcoin price?” In 2024 alone, the total trading volume of Bitcoin reached a staggering $1.25 trillion. With such significant numbers, understanding the price movements is crucial for traders and investors alike. This article delves deep into Bitcoin price chart patterns, equipping you with the knowledge to identify trends, make informed decisions, and optimize your trading strategy.
What Are Bitcoin Price Chart Patterns?
Bitcoin price chart patterns are visual representations of price movements over time. These patterns emerge from the collective actions of buyers and sellers in the market. Essentially, they reflect the psychology behind trading behavior. By identifying these patterns, traders can anticipate future price movements.
- Bullish Patterns: These patterns indicate a potential price rise and can include formations like the Double Bottom and Ascending Triangle.
- Bearish Patterns: These suggest a potential price decline and include the Head and Shoulders and Descending Triangle patterns.
- Continuation Patterns: Patterns such as Flags and Pennants signal that the current trend is likely to continue.
Analyzing Bitcoin Price Chart Patterns
Let’s explore the most recognized chart patterns that have historically helped traders in predicting Bitcoin’s price movements:
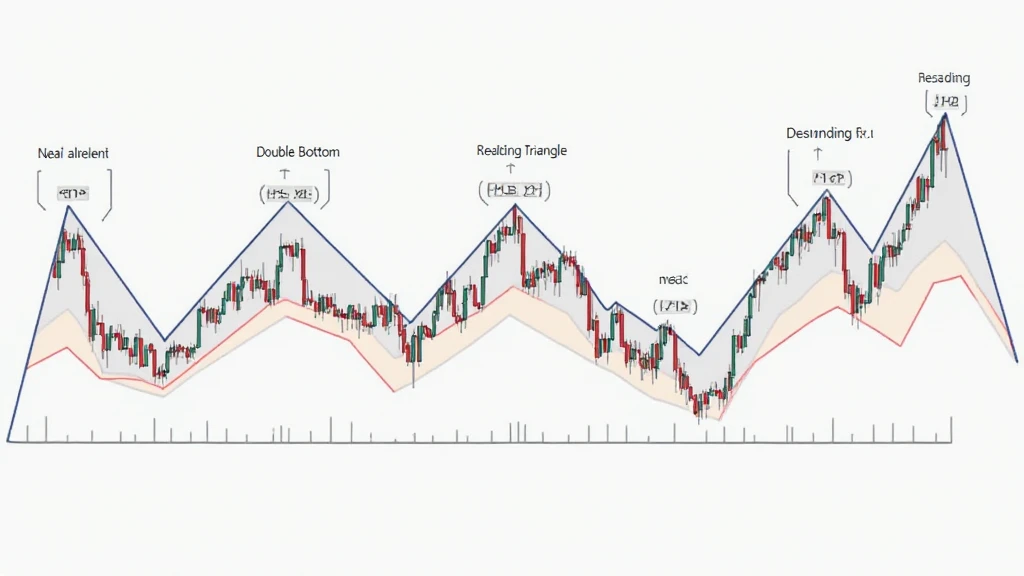
1. Head and Shoulders
This bearish reversal pattern typically appears after a bullish trend. It consists of three peaks with the middle peak (head) being higher than the two others (shoulders). When the price breaks below the neckline, it signals a potential reversal.
2. Double Bottom
The double bottom pattern is a bullish reversal pattern that signifies the price has hit a low point twice before reversing. This pattern suggests investor confidence is returning, often resulting in price increases.
3. Ascending Triangle
This bullish continuation pattern occurs when the price action ranges between a horizontal resistance level and an upward-trending support line. It signifies that buyers are becoming more aggressive, preparing for a breakout to the upside.
4. Descending Triangle
Opposite to the ascending triangle, the descending triangle is a bearish pattern. It showcases a series of lower highs against a horizontal support level, indicating that sellers are gaining control. A breakdown below the support level usually implies a significant price drop.
Importance of Recognizing Patterns in Trading
Being able to recognize these patterns gives traders a vital edge in the market. According to studies, traders who utilize chart patterns have a higher probability of successfully predicting market movements. In the Vietnamese market, for example, the trading volume has surged by 15% recently, highlighting the increasing involvement of traders seeking to understand price movements.
Leverage Tools for Trading
Tools like TradingView provide extensive charting capabilities, helping traders visualize these patterns effectively. Moreover, keeping an eye on news and macroeconomic factors affecting Bitcoin can further enhance decision-making.
Local Market Insights: Vietnam’s Crypto Landscape
Vietnam has seen explosive growth in the cryptocurrency sector, with a reported increase in users by 25% in the past year. This growth indicates a strong interest in Bitcoin, further emphasizing the need for local traders to understand price chart patterns.
Best Practices for Trading Bitcoin
As you navigate the rapidly changing world of cryptocurrencies, here are some best practices:
- Education: Continuously educate yourself on market trends and trading strategies.
- Use Stop Losses: Protect your investment by setting stop-loss orders to minimize potential losses.
- Stay Updated: Keep abreast of market news and geopolitical events that might affect price movements.
Final Thoughts on Bitcoin Price Patterns
Understanding Bitcoin price chart patterns is more than just reading charts; it’s about interpreting the emotions and actions behind every trade. By familiarizing yourself with these patterns, you not only enhance your trading skills but also build confidence in decision-making. As you proceed, remember that leveraging these tools effectively can lead to better trading outcomes.
In summary, Bitcoin price chart patterns provide invaluable insights into market trends, helping you make informed decisions based on historical data. Whether you’re a novice or a seasoned trader, mastering these patterns can be a game changer in the ever-evolving cryptocurrency landscape.
For more comprehensive resources and trading tips, visit hibt.com. Remember, investing in cryptocurrencies carries risks. Consider consulting local regulations and experts before diving in.
Written by Dr. Alex Johnson, a seasoned blockchain analyst with over 10 published papers in cryptocurrency markets and the lead auditor for several high-profile smart contract projects.