Bitcoin Price Analysis Using Bollinger Bands: A Comprehensive Insight
In a crypto market where volatility reigns, understanding price fluctuations is essential for both new and seasoned investors. According to recent studies, over 60% of cryptocurrency traders utilize technical analysis tools to make informed decisions. Bitcoin, as the leading cryptocurrency, presents unique opportunities and risks. In this post, we delve into Bitcoin price analysis using Bollinger Bands, a widely respected technique that can aid in predicting price movements. Whether you are in Vietnam or elsewhere, this guide aims to equip you with practical insights to better navigate the market.
Understanding Bollinger Bands
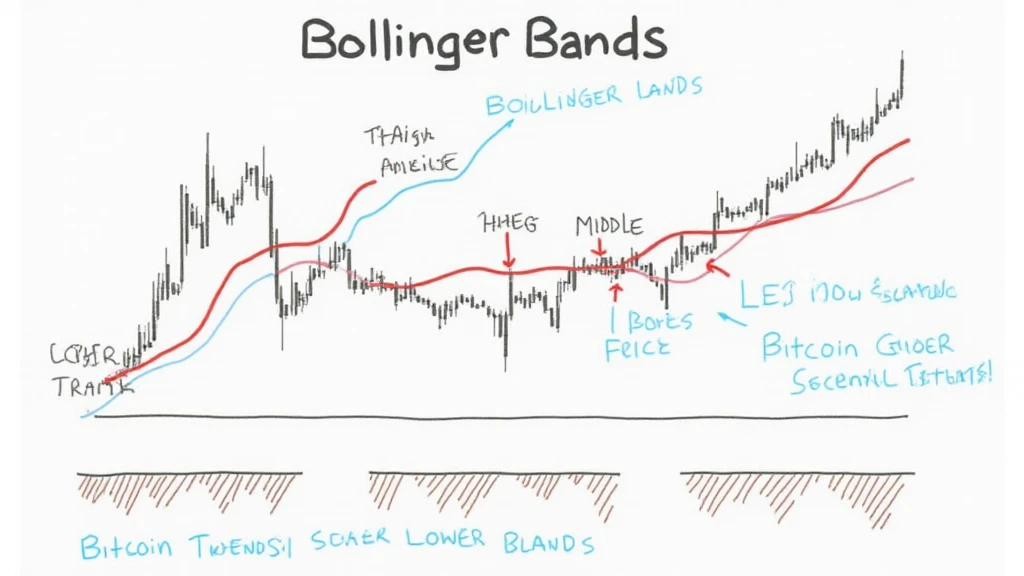
Bollinger Bands are a technical analysis tool that consist of three lines placed on a chart. Developed by John Bollinger in the early 1980s, they are designed to provide a relative definition of high and low prices. The following are key components of Bollinger Bands:
- Middle Band: The simple moving average (SMA) over a defined period.
- Upper Band: The SMA plus two standard deviations.
- Lower Band: The SMA minus two standard deviations.
When prices move closer to the upper band, it indicates that the asset may be overbought, while movement towards the lower band suggests it may be undervalued. Notably, the width between the bands indicates market volatility.

Using Bollinger Bands for Bitcoin Price Analysis
Now that we have established an understanding of Bollinger Bands, let’s discuss their application for Bitcoin Trading.
Interpreting Band Compression and Expansion
Band compression suggests decreasing volatility and is often followed by a price breakout. Conversely, when the bands expand, it indicates increasing volatility and potential market movements. Analyzing these patterns in Bitcoin can provide traders with valuable insights.
In Vietnam, the growing interest in cryptocurrency, with a user growth rate of 18% year-over-year, demonstrates the increasing relevance of sophisticated trading strategies like Bollinger Bands.
Identifying Trend Direction with Bollinger Bands
Traders can utilize Bollinger Bands to identify the prevailing trend in Bitcoin’s price. If the price consistently touches the upper band, the momentum is bullish. Alternatively, frequent touches of the lower band signal a bearish trend. Monitoring these signals is essential for making well-timed entry and exit decisions in trading.
Practical Tips for Bitcoin Trading Using Bollinger Bands
Now that we understand the basics, here are some practical tips to optimize your Bitcoin trading strategy using Bollinger Bands:
- Combine with Other Indicators: Use indicators like RSI (Relative Strength Index) to confirm signals provided by Bollinger Bands. For instance, an overbought RSI alongside price hovering near the upper band is a stronger signal to consider.
- Adjust Settings for Volatility: Adjust the standard deviation settings depending on market conditions. In high volatility markets, you may need to broaden your bands to avoid false signals.
- Know When to Avoid the Market: If you notice price movements that are stagnant or choppy within the bands, it may be prudent to stay out of the market temporarily.
Case Study: Bitcoin Trading in the Vietnamese Market
To further illustrate the efficacy of using Bollinger Bands for Bitcoin price analysis, let’s look at a hypothetical case study focusing on the Vietnamese market. Suppose a trader identifies a band squeeze happening over a six-day period, indicating diminishing volatility. This trader could set alarms to alert them of any breakout beyond either band. Analyzing the price movement after the breakout confirms either a bullish or bearish trend.
This localized approach further enhances your trading precision in a rapidly evolving environment like Vietnam’s, where blockchain technology is gaining traction.
The Future of Bitcoin Price Analysis
As we look toward the future, one thing is clear: technology will continue to evolve. With increasing adoption rates from Vietnam’s younger population, Bitcoin price dynamics will likely shift. Adaptations in technical analysis tools, including AI-driven algorithms, may soon become standard practice. As traders, adapting to these developments will dictate success in this nascent market.
Conclusion
In conclusion, utilizing Bollinger Bands for Bitcoin price analysis provides valuable insights for traders navigating the complexities of the cryptocurrency market. By identifying trends, assessing volatility, and making informed decisions, traders can enhance their performance significantly. Remember, while the tool offers opportunities, it’s crucial to combine these insights with a robust risk management strategy.
For those venturing into cryptocurrency, particularly in volatile markets like Bitcoin, it’s advisable to stay informed about trends and embrace analytics tools. As we continue to see a surge in users—especially in regions such as Vietnam—strategies such as these will become increasingly indispensable for traders.
For more insights and analysis on cryptocurrency trading, visit hibt.com. Remember, this is not financial advice; always consult with local regulators and conduct your due diligence before trading.
As a closing thought, Bitcoin remains a landscape filled with potential rewards and risks. Equip yourself with knowledge and tools, and you’ll be better prepared for your trading journey. Join us at bitcryptodeposit for more resources and tools tailored to enriching your investing strategy.


